
Experts in Vegetation Analysis & Data Driven Inventories
Solutions to Fit your objectives
Tree inventories derived from LiDAR and remote sensing imagery are changing forestry and utility businesses as increasing levels of accuracy and detail are achievable. Forsite bridges the worlds of traditional vegetation management methods and the cutting edge by integrating innovative data-driven forest inventories. We’re forest management specialists and we bring our deep understanding of operational and strategic vegetation management to every phase of the process.
Leveraging LiDAR, satellite data, and our proprietary machine learning technology, Forsite is uniquely positioned to help clients use individual tree metrics to understand the composition, health, and geolocation of their vegetation asset base. Forsite has years of experience creating millions of acres of vegetation inventories. These analyses catalog green assets in order to plan vegetation maintenance based on risk and hazard and provide the foundation for projecting growth by species into the future; highlighting “fast-growers” that will become issues in subsequent maintenance cycles and allowing clients to proactively plan mitigation efforts.
Forsite’s forestry knowledge and expertise applied to leverage your LiDAR, satellite and remote sensing data.
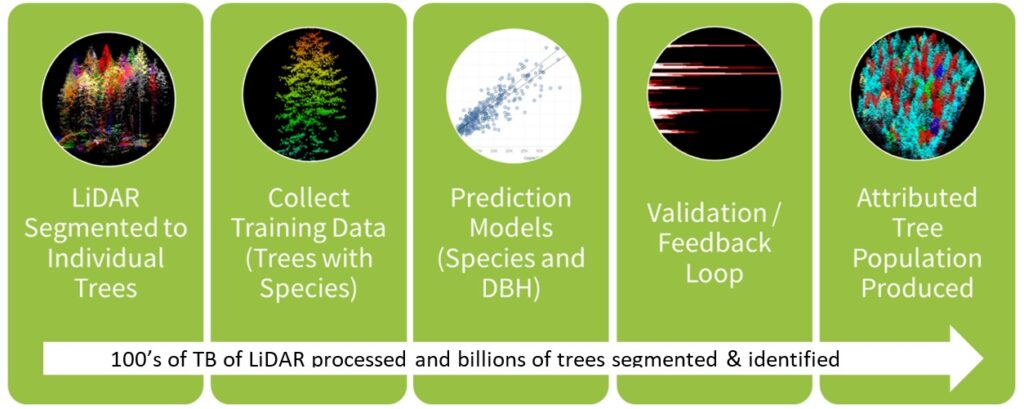
Forsite’s innovative TreeID technology creates individual tree inventories, providing species, tree height, and crown metrics. Once diameter at breast height (dbh) is predicted, biomass can then be calculated for each tree. TreeID can also output environmental metrics like carbon storage, pollution removal, and replacement value.
Forsite is pleased to announce TreeID as a utility vegetation management capability is integrated with Fugro’s ROAMES service offering in North America and Europe.
Forsite’s forestry knowledge and expertise combined with seasoned fire weather and behavior specialists and skilled remote sensing analysts.
In our changing climate, electrical utilities face unprecedented challenges and have been witnessing their largest asset losses ever due to wildfires. At Forsite we’ve been at the forefront, collaborating closely with utilities to mitigate these risks. Our dedicated team has been hard at work, developing innovative wildfire situational awareness products designed to alert utility operations during periods of elevated wildfire weather conditions, as well as prepare utilities by helping prioritize risk mitigation activities.
The Advantage
Health and species data help identify high-risk trees as well as create species-specific growth projection. The identification of danger trees and branching issues with automated remote sensing allows field teams to quickly identify high-priority areas and reduce costs by leveraging human expertise and minimizing risk to people and property.
Forsite is unrivaled in the depth of knowledge and skills we can apply to create innovative solutions that match your inventory needs.
Inputs
TreeID requires LiDAR with a point density of 10 pts/m2 or higher to conduct a species identification. More point density is a benefit and provides TreeID a richer analysis foundation. Ground truth samples are selected from the project area and used to create the species identification model.
Outputs
TreeID outputs are geospatial vector files (shapefile or *.gdb) compatible with any GIS system. Each individual tree is fully attributed with desired project metrics such as species, type (conifer/deciduous), and health (live/dead). Attributes also include standard LiDAR calculations like height, elevation, and slope; tree metrics like board feet or volume; and environmental metrics like carbon storage, pollution removal, and replacement value.
VEGETATION ANALYSIS WITH INTRUSION CODES
Standard industry requirements involve analysis of the point cloud to determine possible intrusion of vegetation with transmission and distribution lines. After automatically identifying danger trees and branching issues, field teams can rapidly identify high-priority areas and reduce costs by better leveraging human expertise and minimizing the risks to people and property.
Intrusion Codes and Tree Health
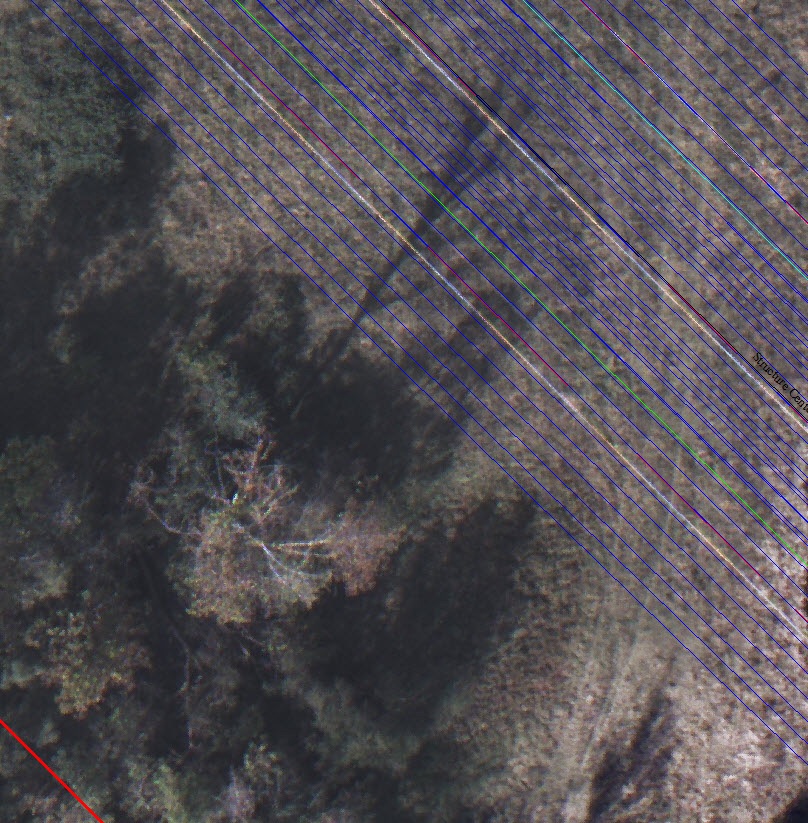
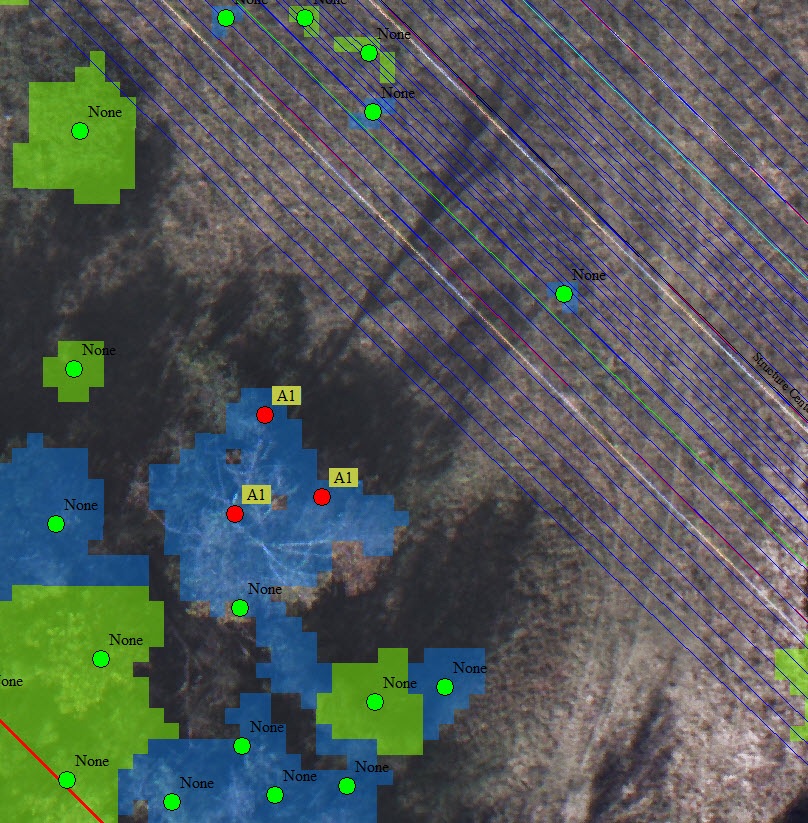
Overhead imagery and line models shown in Figure 1. Tree overlay with Fall-In intrusion codes in Figure 2. Blue Canopy = Dead tree. Green Canopy = Live Tree. Intrusion code (None-green, P3-white, P2-yellow, P1-orange, A1-red).
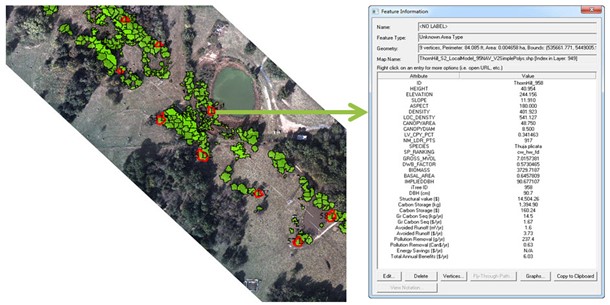
IDENTIFYING DEAD TREES IN THE CORRIDOR
A typical analysis to identify conifer from deciduous trees along the corridor as well as discern dead trees. In the images below we can see two live trees and one dead tree in the corridor. Trees #1 and #2 are live conifers and #3 is a dead conifer.
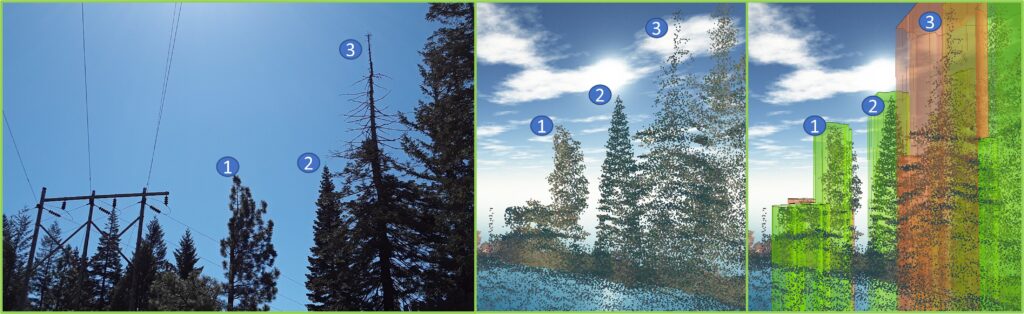
At the far left, the image taken by the field crew shows the utility lines and three conifer trees to the east. In the center image, the same three conifers are visible in the LiDAR point cloud. And at the far right, we can see the TreeID geospatial 3D vector segmentation overlaid on each tree. The green overlay represents trees that TreeID called live conifer and the orange overlay represents trees that TreeID called dead conifer.
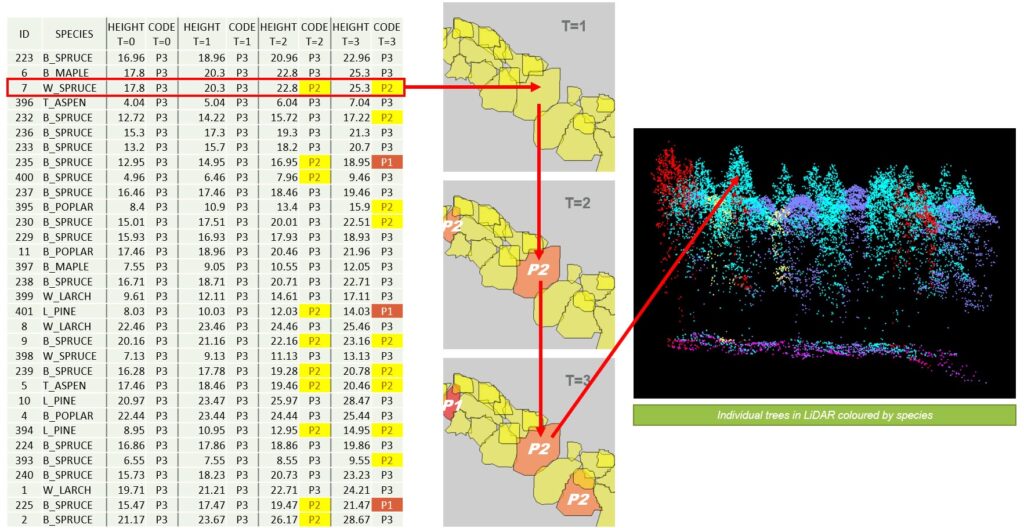
MANAGE GROWTH & FORECAST CLEARANCE HAZARDS
With the species determined, we have the foundation for realistic growth projections using local area site knowledge and growth & yield curves. If LiDAR or SGM data is available from multiple time periods, growth rates in those coverage areas can be refined for greater accuracy. Using either approach, Forsite can provide vegetation managers with individual tree growth projections combined with clearance analyses to identify line sections that will have the highest concentrations of at-risk fast growers in future cycles. That information can then inform vegetation management plans and sections can be prioritized accordingly.
CORRIDOR SPECIES And Health ANALYSIS
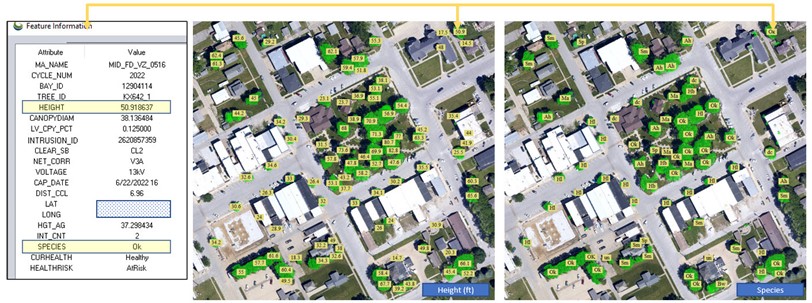
Forsite’s individual tree inventory (ITI) outputs are geospatial vector files (shapefile or *.gdb or *.kmz) that are compatible with any GIS system. Each individual tree can be fully attributed with desired project metrics such as species, type (conifer/deciduous), and health (live or dead, stress/vigor). Attributes also include standard LiDAR calculations such as height, elevation, and slope. Timber metrics like board feet or volume and environmental metrics like carbon storage, pollution removal, and replacement value can be included if desired.
“Current Health” and “Health Risk” are derived from the normalized difference vegetation index (NDVI). Current Health is a snapshot in time (June 2022) and reflects the relative vigor of a given tree as compared to other trees in the project area. In the screen capture above, green=Healthy and red=Dieback. Health Risk is derived from multiple years of NDVI analysis (imagery from 2014-2021) and reflects the relative health trend of a given tree, again as compared to its neighbors. In the screen capture on the right below, green=No Risk and red=At Risk
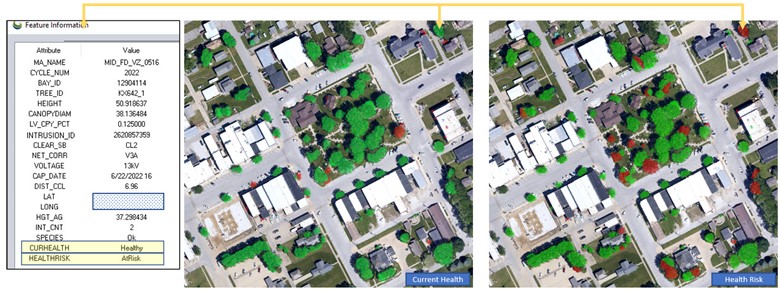
The figure below shows a Dx circuit in the project area. Highlighted is tree #KX642_1, a 50’ oak tree. In addition to species, the tree is attributed with health and circuit intrusion hazard information.
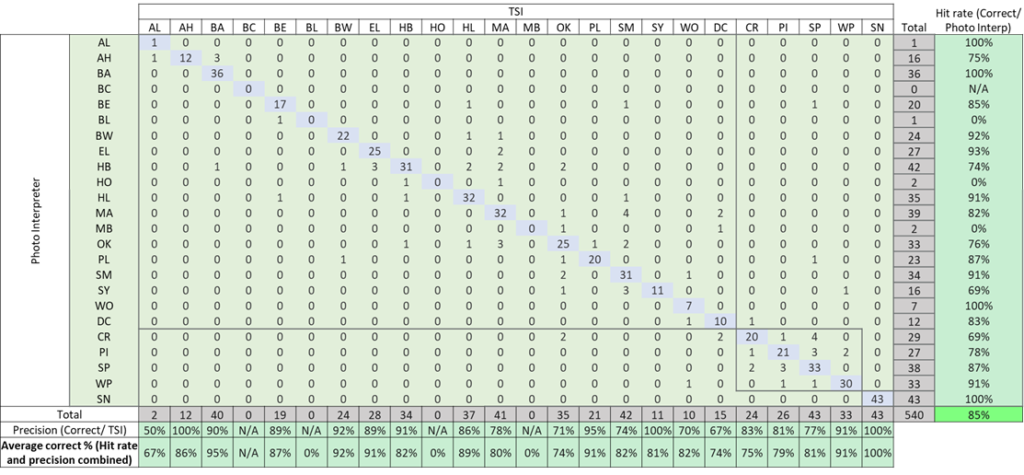
The table below shows the species accuracy for a project area of 11,500 line miles. The species mix is predominantly deciduous and accuracies were aided greatly by the spectral information available from satellite and ortho imagery.
Explore our Interactive Enhanced Inventories Page →
Contact Us